
Dashboards
Introduction
WarehousePro contains some informative screens (Dashboards) which can be requested via the web browser. The available dashboards with their options are explained below. Each dashboard can be accessed via the URL of the WarehousePro Endpoint. The needed values can be viewed in the B1ProSuite Software Platform:
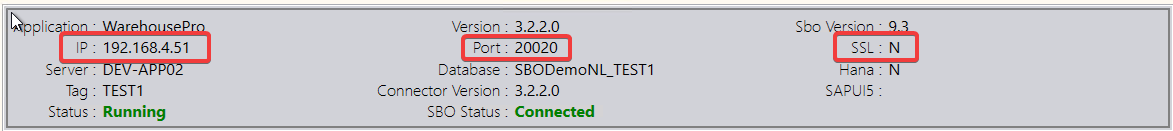
If the IP setting has no value, you should be able to use any address of the server. When SLL settings is "Y" the use "https" Else use "http".
Port: This is the communication port through which the dashboards are made available.
Based on the image above, the URL should be as follow:
http://192.168.13.17:20020/
These dashboards are available in WarehousePro version 3.1.2.9 or higher.
KPI Dashboard
The KPI dashboard is available if the expanding license has been purchased and activated on the WarehousePro installation.
The KPI Dashboard consists of 2 parts:
Open sales orders and pick lists.
Open purchase orders.
Note
The data for this dashboard is refreshed by the endpoint every 15 minutes. This refresh is not adjustable.
URL: /Sites/KPI_Dashboard/
OptionalURL parameters:
Language
Select from available languages of WarehousePro -For example NL for Dutch.
Interval (default value= 20 seconds)
Specify the interval in seconds of the page refresh (not the data!).
Warehouses (default value= all)
Specify which warehouses are relevant to display. Multiple warehouses can be specified. Separate the warehouse codes with a comma (,).
OnlyInbound
When included (= Y), only "Open purchase orders" dashboard is displayed. This parameter cannot be combined with OnlyOutbound.
OnlyOutbound
When included (= Y), only the "Open sales orders and pick lists" dashboard is displayed. This parameter cannot be combined with OnlyInbound.
In the URL, the first parameter is preceded by a question mark (?). The parameters can also be combined. If a 2nd parameter is added, it is preceded by the ampersand sign (&).
Some example URLs:
http://192.168.13.17:20020/Sites/KPI_Dashboard/?Language=NL
In this example, only the language (Dutch) is specified. Furthermore, the standard interval of 20 seconds will be used and both the Open sales orders and pick lists and the Open purchase orders dashboard will be displayed with information from all SAP Business One warehouses.
http://192.168.13.17:20020/Sites/KPI_Dashboard/?Language=NL&Interval=30
In this example, both the language (Dutch) and the interval (30 seconds) are specified. Furthermore, both the Open sales orders and pick lists and the Open purchase orders dashboard will be displayed with information from all SAP Business One warehouses.
http://192.168.13.17:20020/Sites/KPI_Dashboard/?Warehouses=01,05
In this example, only the SAP Business One warehouses 01 and 05 are included in the dashboard. Furthermore, the dashboard is displayed in the default language and both the Open sales orders and pick lists and the Open purchase orders dashboard are displayed with a standard interval of 20 seconds.
http://192.168.13.17:20020/Sites/KPI_Dashboard/?OnlyInbound=Y
In this example, only the Open purchase orders dashboard is shown with information from all SAP Business One warehouses. Furthermore, it is displayed in the deafult language using the default interval of 20 seconds.
http://192.168.13.17:20012/Sites/KPI_Dashboard/?OnlyOutbound=Y
In this example, only the Open sales orders and picking lists dashboard is shown with information from all SAP Business One warehouses. Furthermore, it is displayed in the standard language with the standard interval of 20 seconds.
Open sales orders and picking lists
This dashboard shows current information about the progress in the warehouse regarding the delivery of sales orders. The time of the last data refresh is displayed in the top right corner.
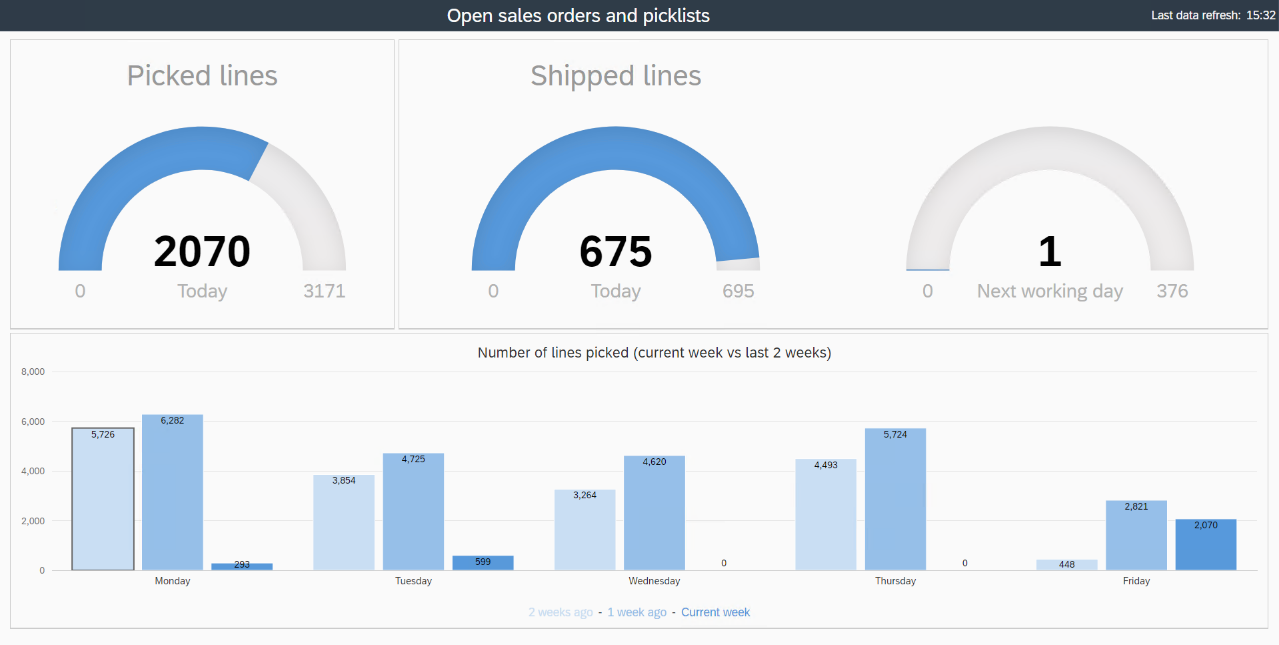
Picked lines This "meter" is the number of lines picked relative to the number of lines to be picked with today the pick date. Lines of still open pick lists from an earlier or later date are not included in this view.
Shipped lines These two "meters" show the number of lines delivered today and the next working day. Here the delivery date in the order lines is looked at. Lines of still open order lines from an earlier or later date (than today or the next business day) are not included in this view.
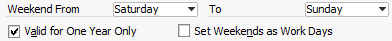
Number of lines picked(currentweek vs last2 weeks) This graph shows the number of pickedlines per day in the week and compares this with the previous 2 weeks. Via the Holiday calendar of SAP Business One (Administration> System Initialization > Company Details: Accounting Data tab) it can be determined which days are designated as a weekend and thus hidden in the dashboard.
If the Warehousesparameter is used in the URL, only the lines corresponding to the specified warehouses are displayed.
Open purchase orders
This dashboard shows current information about the progress in the warehouse with regard to receiving new stock via purchase orders. The time of the last data refresh is displayed in the top right corner.
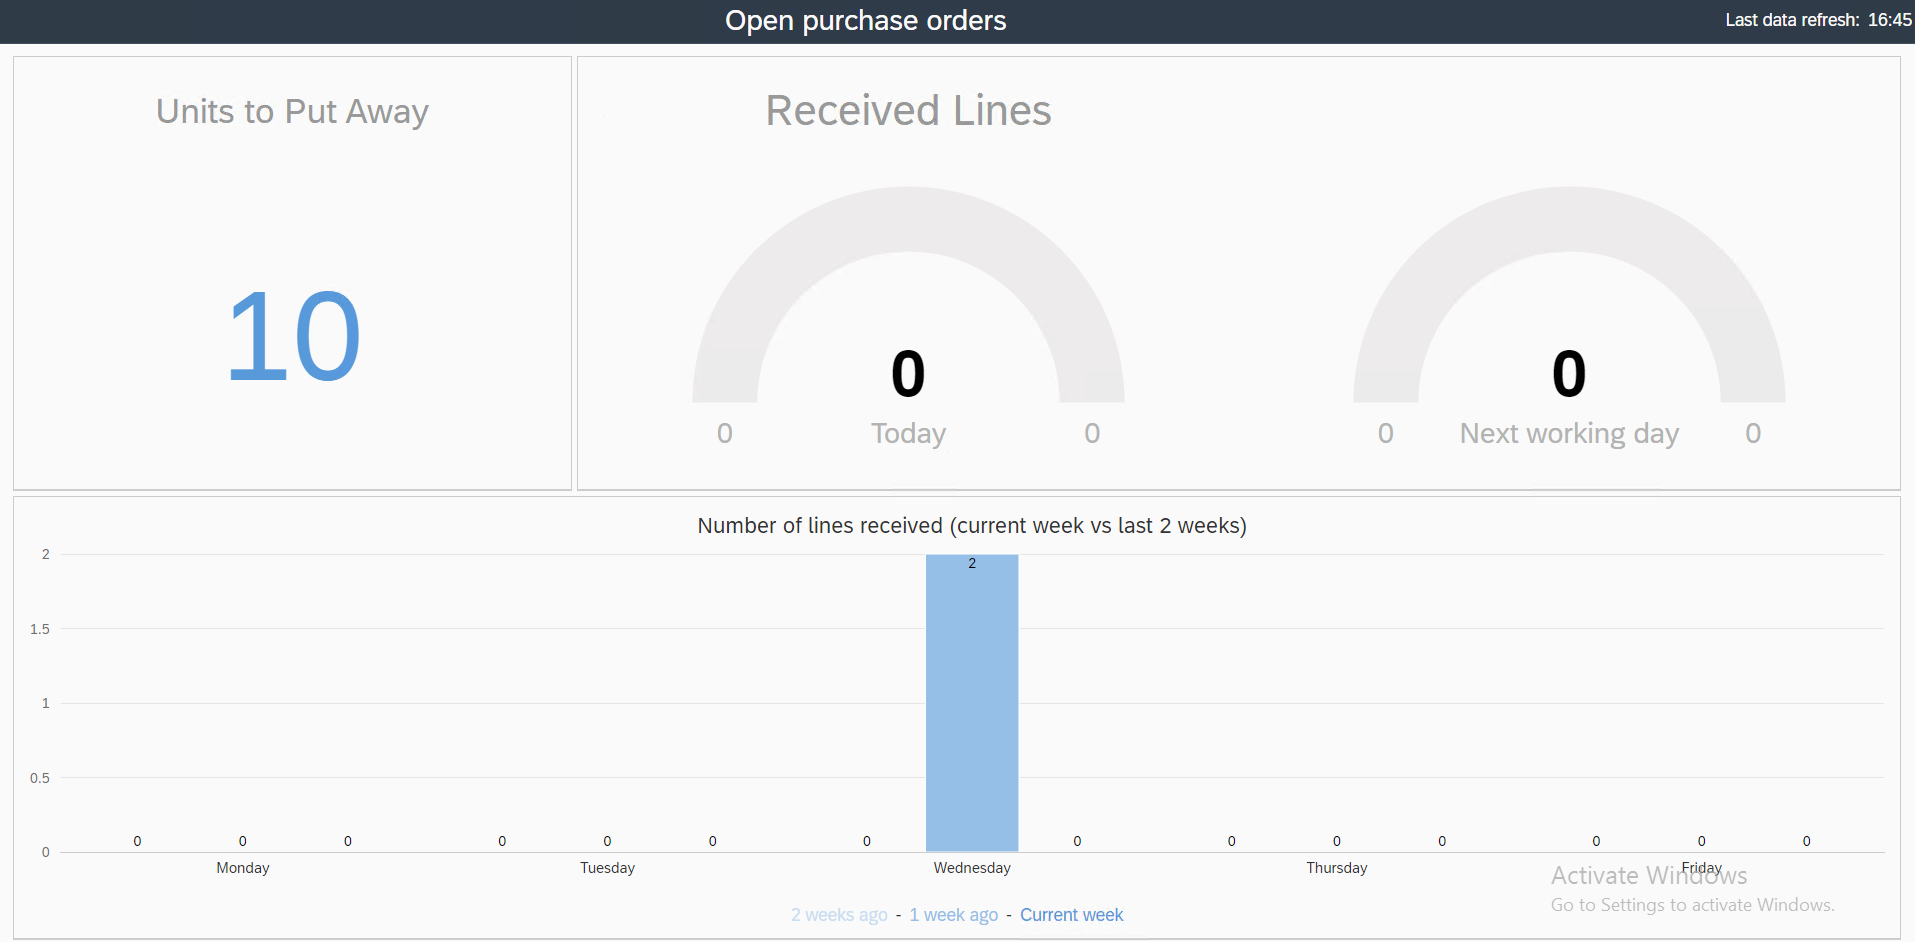
Units to Put Away This number indicates the number of (stock) units still to be put away. All set "Put Away" locations are included.
Received lines These two "meters" show the number of lines received today and the next working day. Here the delivery date in the order lines is looked at. Lines of still open order lines from an earlier or later date (than today or the next business day) are not included in this view.
Number of lines received (currentweek vs past 2 weeks) This graph shows the number of lines received per day in the week and compares this with the previous 2 weeks. Via the Holiday calendar of SAP Business One (Administration > System Initialization > Company Details: Accounting Data tab) it can be determined which days are designated as a weekend and thus hidden in the dashboard.

If the Warehousesparameter is used in the URL, only the lines corresponding to the specified warehouses are displayed.
Reports Dashboard
A "management" Reporting dashboard is available in WarehousePro. This dashboard is available in SAP Business One via WarehousePro > Reports> Dashboard. This dashboard can be opened via the "External browser" icon in yourpreferredweb browser if desired. It is also possible to open this dashboard directly in the browserby copying the URL of the report.
URL: /Sites/Dashboard/
Optional URL parameters:
Language
Select from available languages of WarehousePro -For example NL for Dutch.
Some sample URL’s:
http://192.168.13.17:20020/Sites/Dashboard/
In this example, the dashboard is opened in the default language.
http://192.168.13.17:20012/Sites/Dashboard/?Language=NL
In this example the language Dutch is specified.
When the dashboard is opened from SAP Business One in the external browser, a token from the SAP Business One session is added to the URL. This automatically uses the user's language.
The dashboard contains various reports about
Delivery reliability
Locations
Items
Users
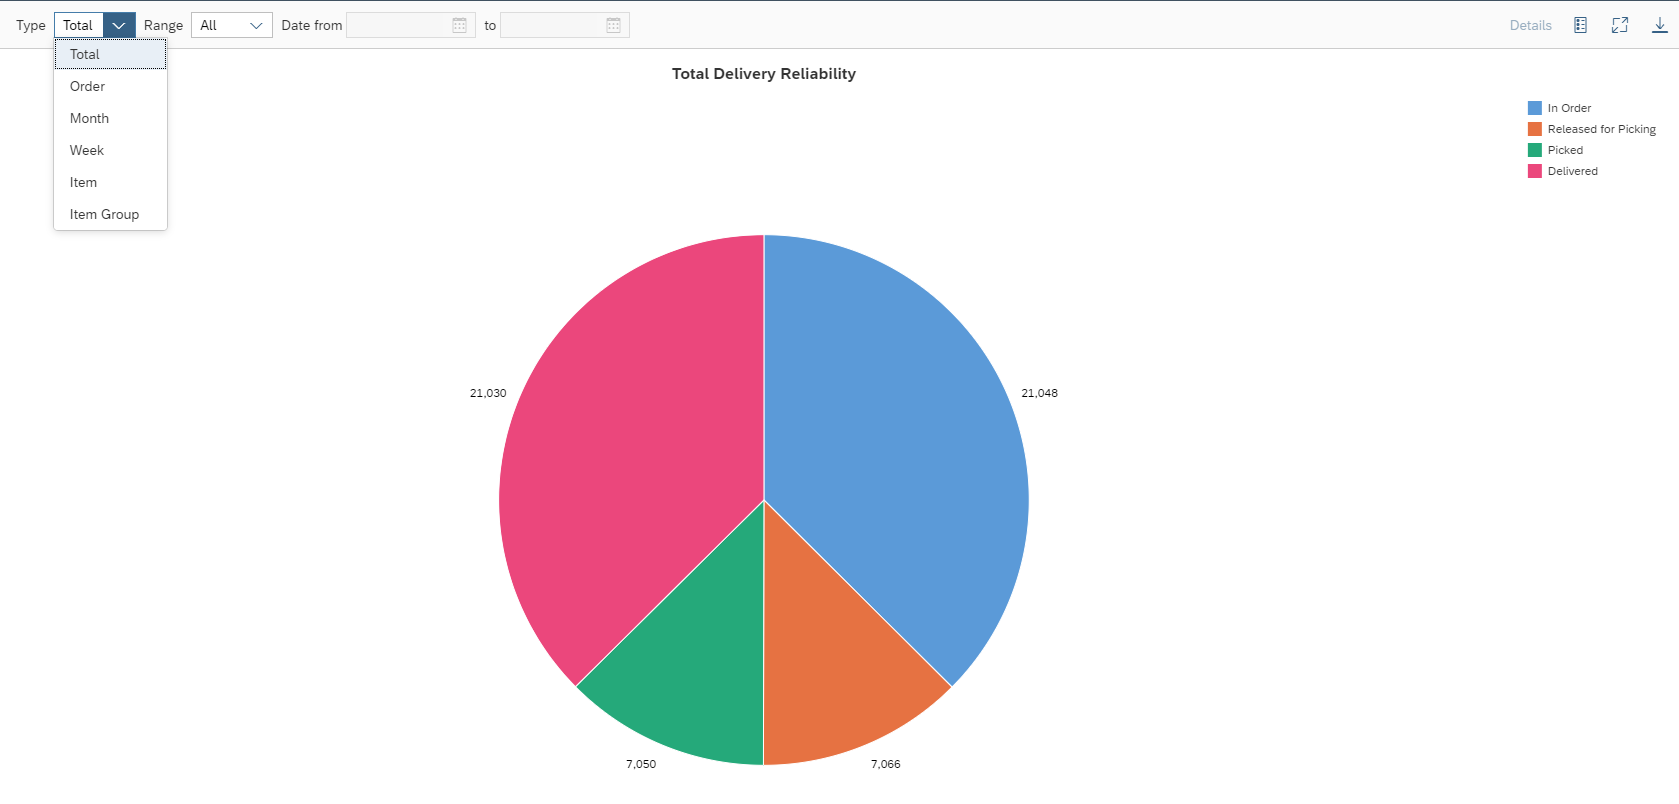
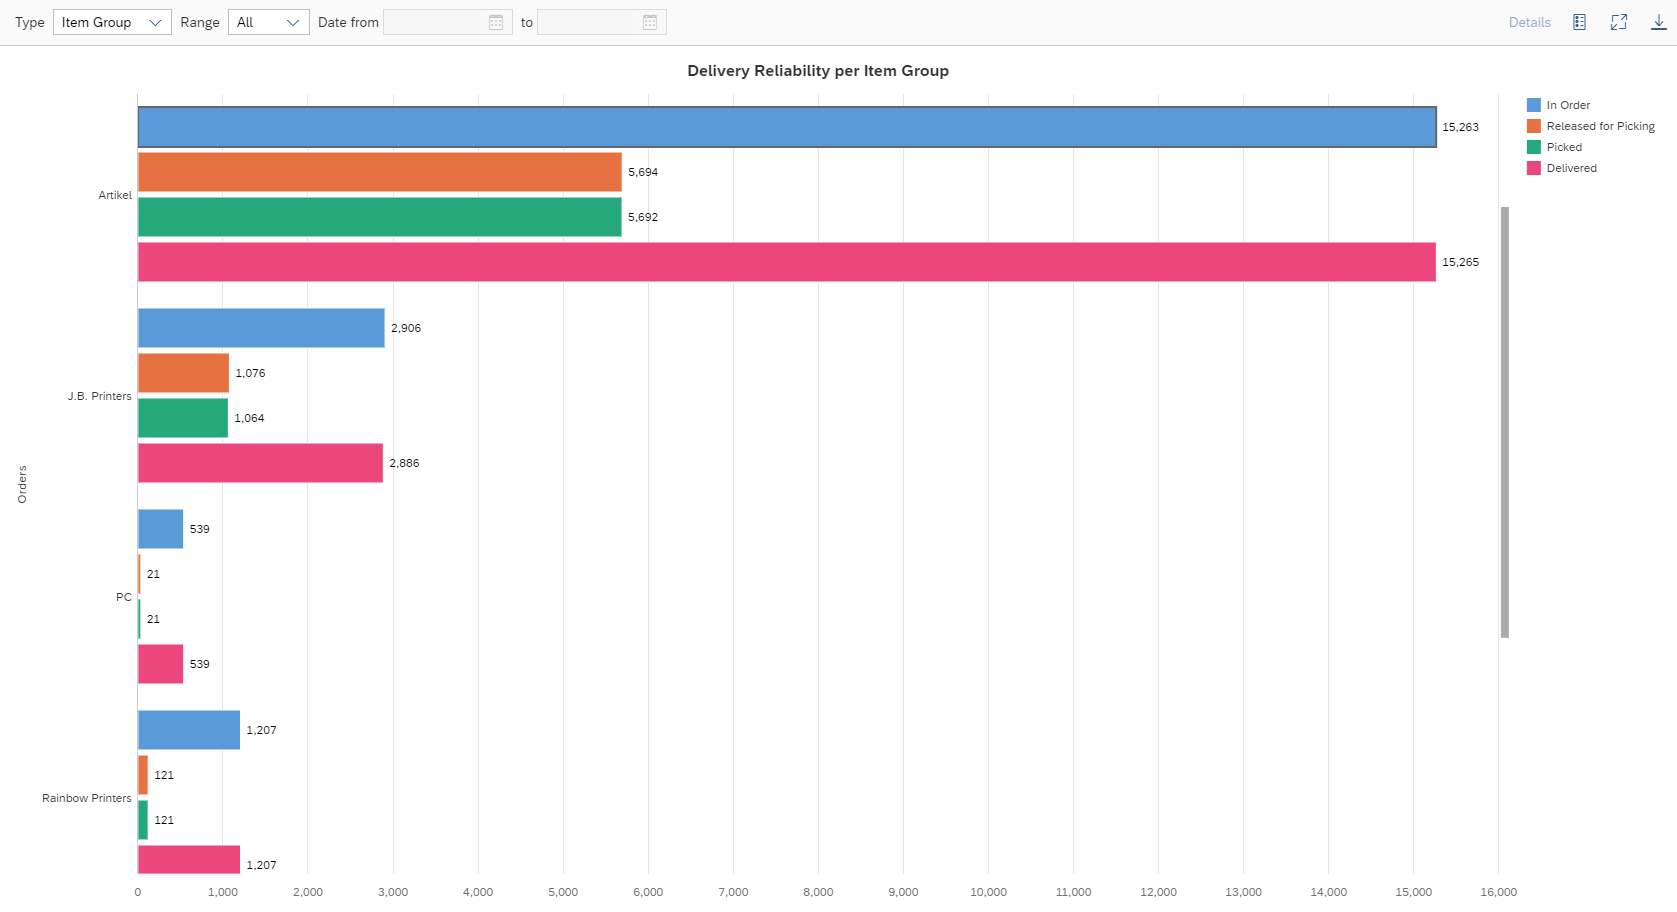
Delivery Reliability
This report shows in various display options the delivery reliability of orders. The number of order lines is compared to the numbers supplied and between them the number to be picked and the numbers that have already been picked. You can filter on a specific period and group on a desired angle.
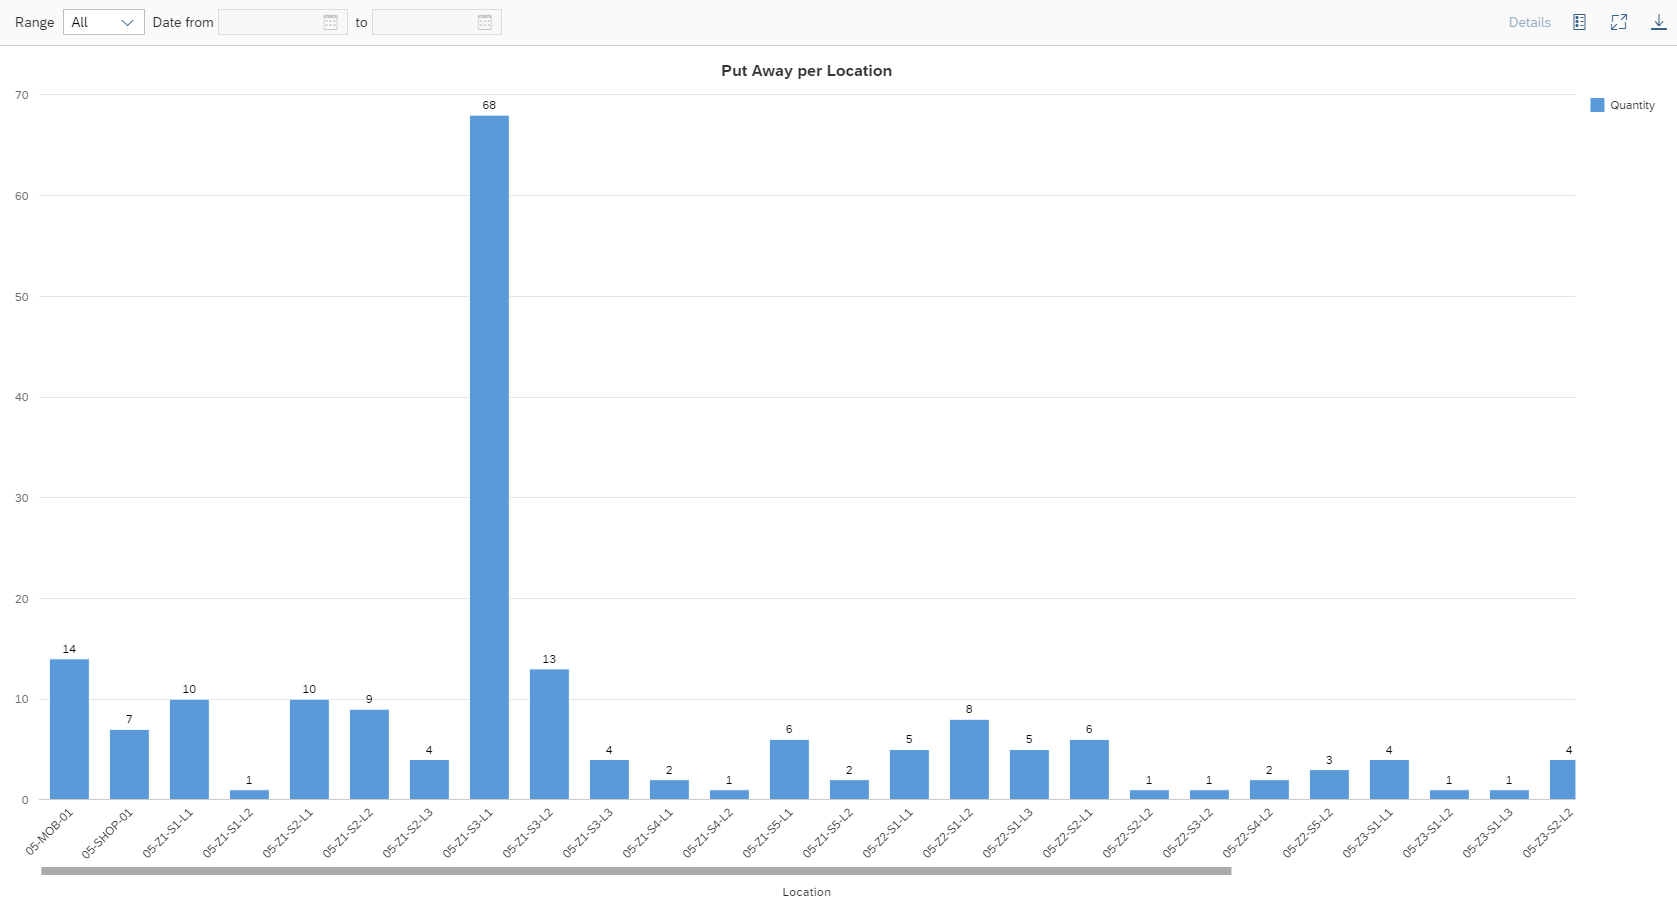
Locations
Viewed from various WarehousePro functionalities, an overview is generated of the most touched locations. This concerns the functions Production / Order Picking, Put Away or Stock Transfer.
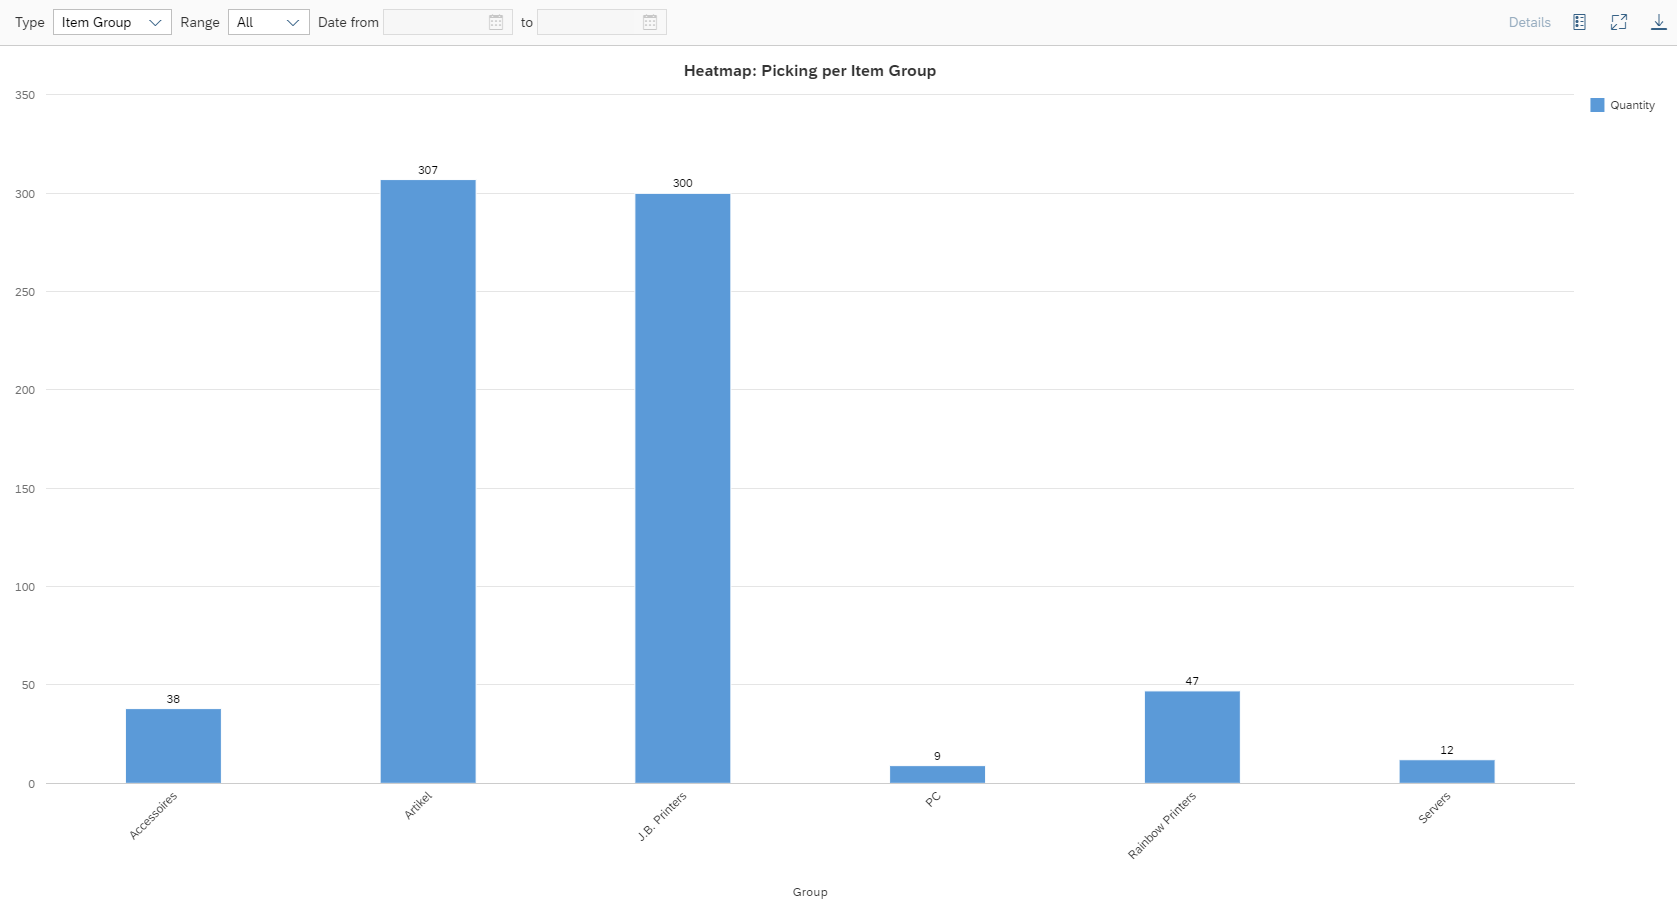
Items
Also for items (or grouped by article group) an overview can be generated of most touched items. Again for the Production / Order Picking, Put Away or Stock Transfer functions.
There are also overviews to monitor the expiration date for batch-managed items.
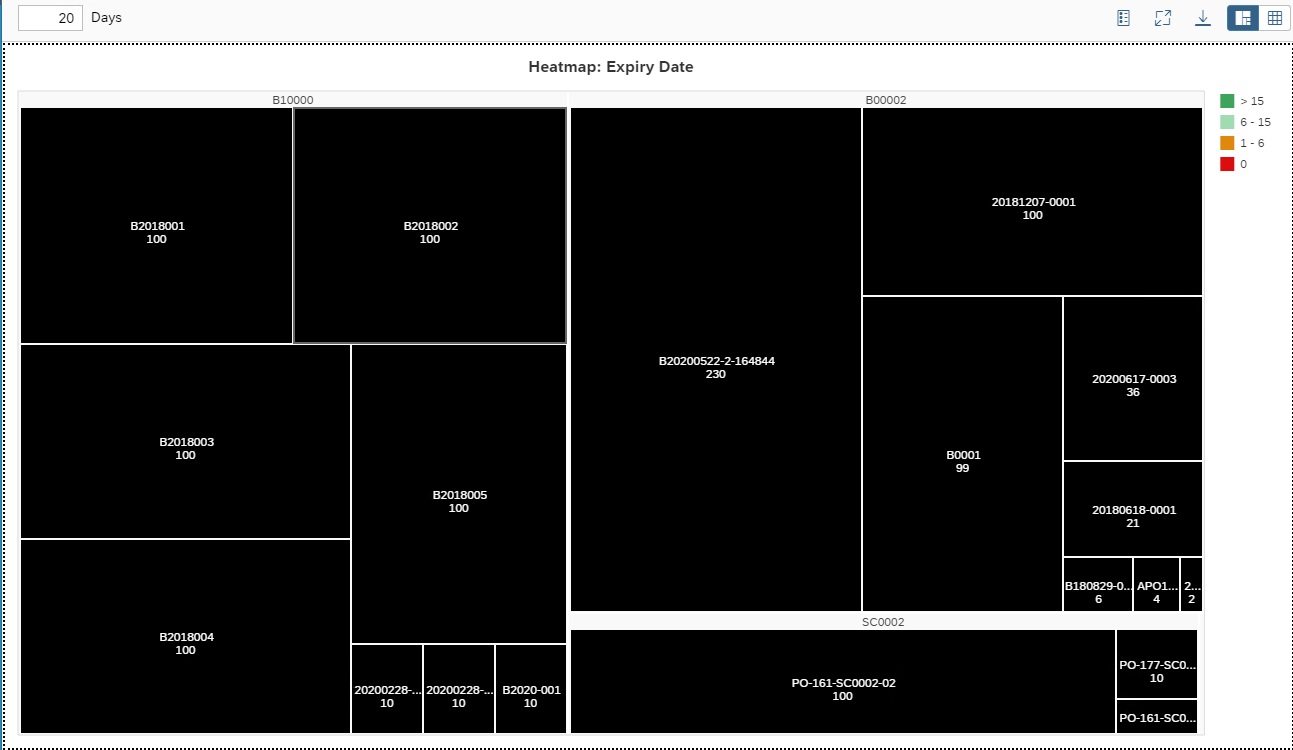
The example above shows the batches with stock per item that are likely to expire within 15 days. Or have already expired (red).
In addition, an overview is available that can be used to detect thatthere is less than a full sales unit at a location of an item.
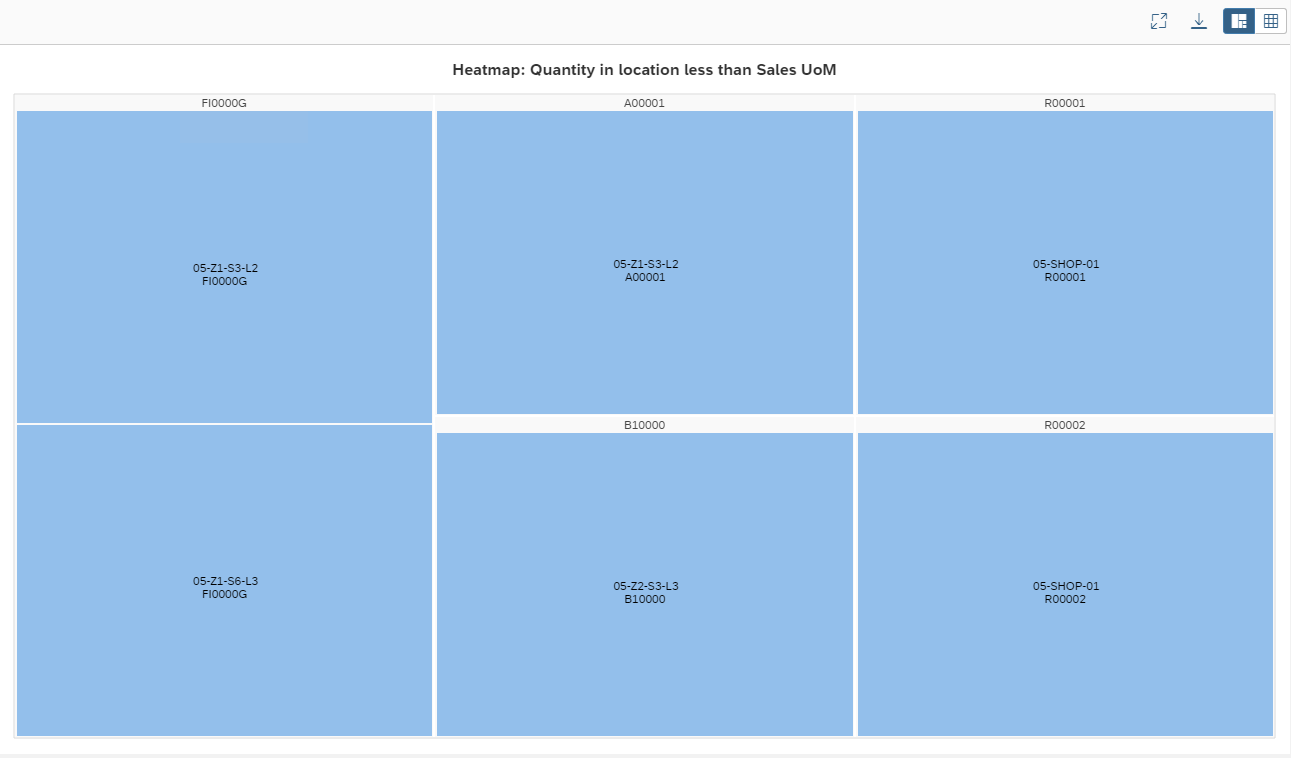
This overview is generated by comparing the Sales Quantity UoM to the available inventory of the item at a warehouse location. The locations are listed in groups per item.
Users
This group of overviews relate to the users. For example, there can be an overview per application of the total number of processed lines or the average processing time of a task in minutes within a certain period.
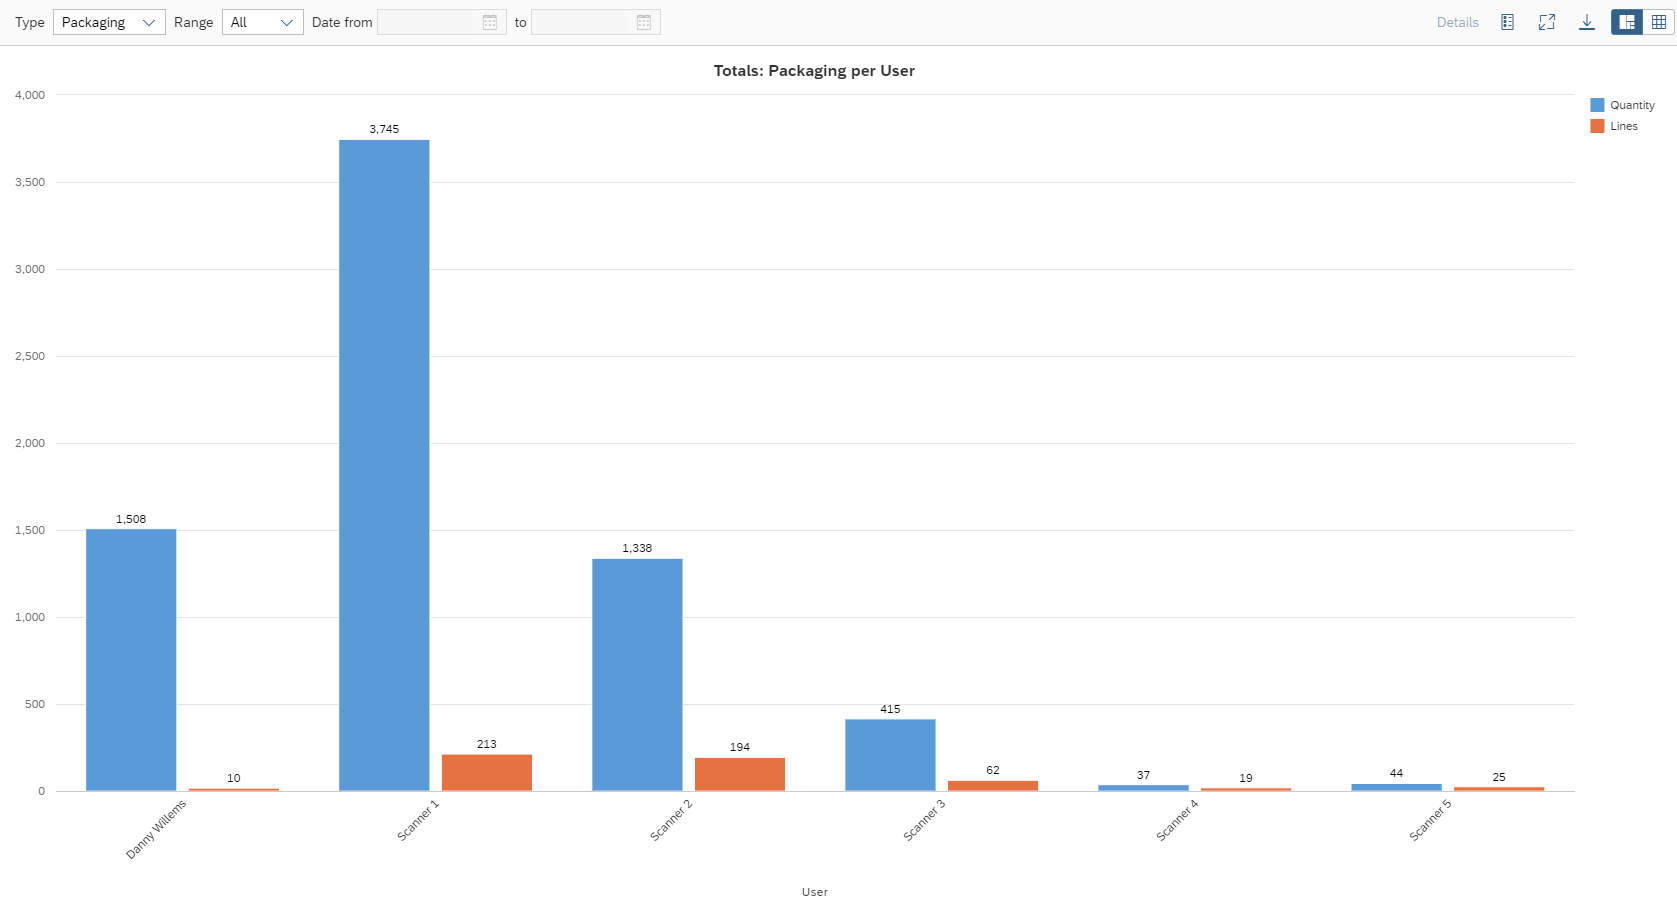
For this, the data from the WarehousePro tasks are compared with the data from the source documents.